
Candidates bind a thick formula sheet, then lose the question anyway, because the hard part is knowing which of the 25 formulas the stem is asking for. Open book changes what the exam tests, not how much you need to know.
Why does an open-book exam still need formulas in your head?
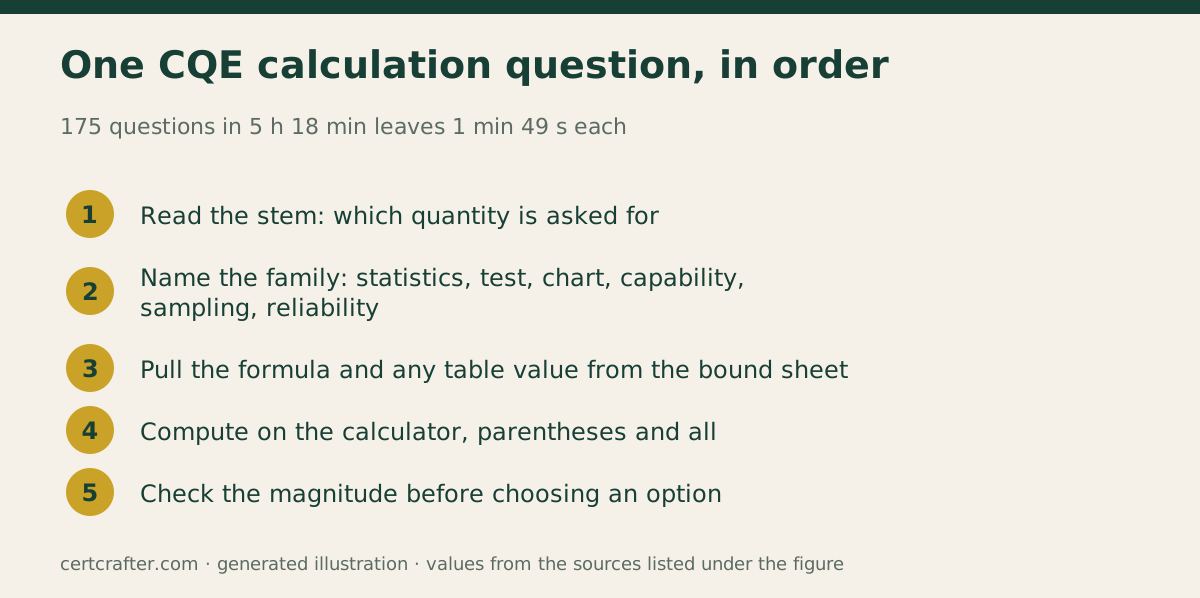
Because of the clock. The CQE is 175 questions in 5 hours 18 minutes, which is 1 minute 49 seconds a question, and ASQ’s handbook says the exam is written so a simple calculator is sufficient. A question that gives you Rbar and n and asks for the process sigma is not testing whether you can find Rbar over d2 in a binder. It is testing whether you know, before the binder opens, that the answer is Rbar over d2 and not Rbar over A2.
Working engineers meet the same thing on the floor. The capability report is due, the data is on the screen, and the engineer who has to check whether Cpk uses three sigma or six is the one who sends the wrong number to the customer. The formulas below are the ones the exam leans on, grouped by the kind of stem that calls for them.
Which 25 formulas does the CQE lean on?
| Family | The formulas, by name | The stem that calls for them |
|---|---|---|
| Sample statistics | Mean, sample standard deviation, standard error of the mean | Raw data, or a question about a sample mean |
| Probability rules | Addition rule, multiplication rule with a conditional | Two events joined by “or” or “and”, draws without replacement |
| Distributions | Binomial, Poisson, normal z score, exponential reliability | Counts of defectives, defects per unit, a fraction beyond a limit, a constant failure rate |
| Intervals and tests | Interval for a mean with t, interval for a proportion, one-sample t, F for two variances, chi-square goodness of fit | “Estimate”, “is there a difference”, “do the counts fit” |
| Regression | Slope with intercept, correlation r | Paired x and y data, “predict” or “how strong” |
| Control charts | Xbar limits with A2, R limits with D3 and D4, p chart limits, sigma from Rbar over d2 | Subgroup data, Xbarbar and Rbar, fraction defective per sample |
| Capability | Cp, Cpk, DPMO | Specification limits with a mean and a sigma, defects per opportunity |
| Acceptance sampling | Probability of acceptance, AOQ | A plan n and c with an incoming p, rectifying inspection |
Just outside the 25 sit series and parallel reliability, gage R&R, takt time and OEE. They are quick marks when they come, and the kit’s method sheet carries them with the same “when to use it” note.
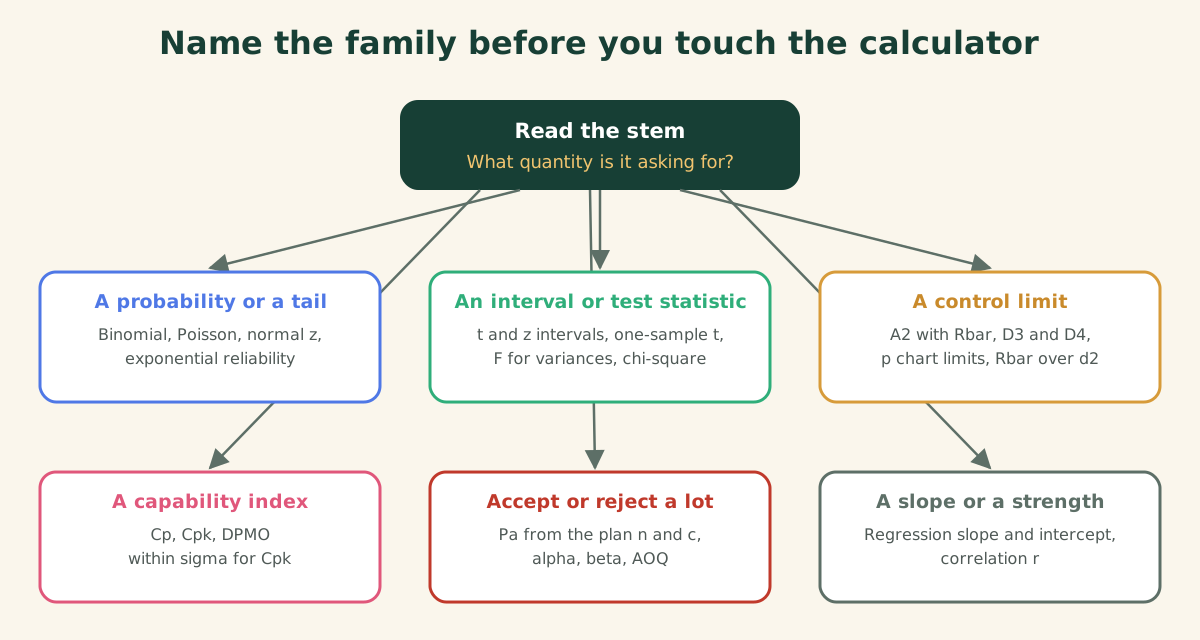
How do you choose the right one in under two minutes?
Read the stem for the quantity it asks for, then name the family before you touch the calculator. Six formulas show the pattern.
Sample statistics turn on one choice of divisor. The sample standard deviation is s = sqrt(sum((x - xbar)^2) / (n - 1)), with n minus 1, and the standard error of a mean is that s over the square root of n. The stem that says “a sample of 25 means” wants the standard error; the one that says “an individual part” wants s.
The z score, z = (x - mu) / sigma, converts a limit into a tail you read from the table. It is the formula behind percent out of specification, process yield and the normal approximation, and the wrong tail is the commonest way to lose it.
The binomial, P(X = x) = C(n, x) p^x (1 - p)^(n - x), handles a fixed number of trials with a fixed chance per trial. When n is at least 20 and p at most 0.05, the Poisson with its mean at np is the shortcut the examiner expects, because each term is the previous one times the mean over x.
Control chart limits are a center line plus or minus a constant times a spread: UCL = Xbarbar + A2 Rbar for subgroup means, with A2 belonging to Rbar, A3 to sbar and E2 to the moving range. For n = 5, A2 is 0.577, D4 is 2.114, D3 is 0 and d2 is 2.326.
Capability is distance to the nearer limit in units of three sigma: Cpk = min((USL - xbar) / (3 sigma), (xbar - LSL) / (3 sigma)), with the within sigma from Rbar over d2. Cp uses the full tolerance over six sigma and ignores centering.
Acceptance sampling asks for Pa = P(X <= c), the cumulative probability from zero through c, from the binomial or the Poisson. Producer’s risk is 1 minus Pa at the AQL; consumer’s risk is Pa itself at the LTPD.
Worked example: Cp, Cpk and Cr from one specification
A ground diameter has LSL 9.950 mm, USL 10.100 mm and a target of 10.025 mm. The subgroups give a mean of 10.030 and a within sigma, from Rbar over d2, of 0.020.
- Cp = (10.100 minus 9.950) / (6 × 0.020) = 0.150 / 0.120 = 1.250.
- Cpu = (10.100 minus 10.030) / (3 × 0.020) = 0.070 / 0.060 = 1.167.
- Cpl = (10.030 minus 9.950) / 0.060 = 0.080 / 0.060 = 1.333.
- Cpk is the smaller of the two, 1.167.
- Cr = 1 / 1.250 = 0.800, so the process uses 80% of the tolerance.
Capable, and off center on the high side. If the stem had given the overall standard deviation instead, 0.030 here because the mean drifted between subgroups, the same arithmetic gives Pp 0.833 and Ppk 0.778, and the option built from the overall s is sitting among the distractors waiting for you.
The ASQ CQE Complete Exam Kit carries the formula and method sheet with a “when to use it” line and the classic mistake for every formula, plus statistical tables computed for the kit, all built to be bound and taken into the exam.
Where do working engineers get these wrong?
The mistakes on the exam are the mistakes from the plant, which is why they make good distractors. Dividing by n instead of n minus 1 for a sample standard deviation. Putting six sigma under Cpk. Building a p chart from the number of defectives instead of the fraction, so the limits stop making sense the moment a sample size changes. Reading the producer’s risk off the OC curve as if it were the probability of acceptance.
Then there are the mixed-sigma errors. A capability study that uses the overall s for Cpk reports a process as worse than it is; one that uses Rbar over d2 for Ppk reports it as better than it was. Gage studies have their own thresholds, under 10% acceptable and over 30% unacceptable, and the question will say whether the percent is against total variation or against the tolerance. Read which.
How does the exam frame formula questions?
Most calculation stems sit at Apply or Analyze on Bloom’s taxonomy: they give the numbers and the words, and the words decide the formula. “Fraction defective” is a p chart; “defects per unit” is c or u. “Sigma unknown” with a small sample is t, not z. “Without replacement” from a small lot is hypergeometric, and when a question names a distribution, use the one it names.
The distractors are built from the near-miss formula. P(d = c) alone where Pa was asked. Alpha quoted as 0.95. The farther specification limit in Cpk. A negative lower limit left negative on an attribute chart instead of floored at zero. Each is the right arithmetic applied to the wrong formula, which is the exact skill 1 minute 49 seconds is testing.
What to do next
Write your own sheet by family, one page per family, with the stem words that call for each formula next to it. Then sit the free 20-question sample with that sheet and see which families you reached for too slowly. Unofficial: CertCrafter is not affiliated with ASQ, and ASQ does not endorse this page.
Comments
Comments are read by a person before they appear. How we moderate.