Most CQE candidates can quote the Xbar-R limit formulas and still miss the question, because they reach for A2 with sbar or apply D4 to the Xbar chart. The constants stop being interchangeable once you know what each one is.
What do d2, A2, D3 and D4 actually measure?
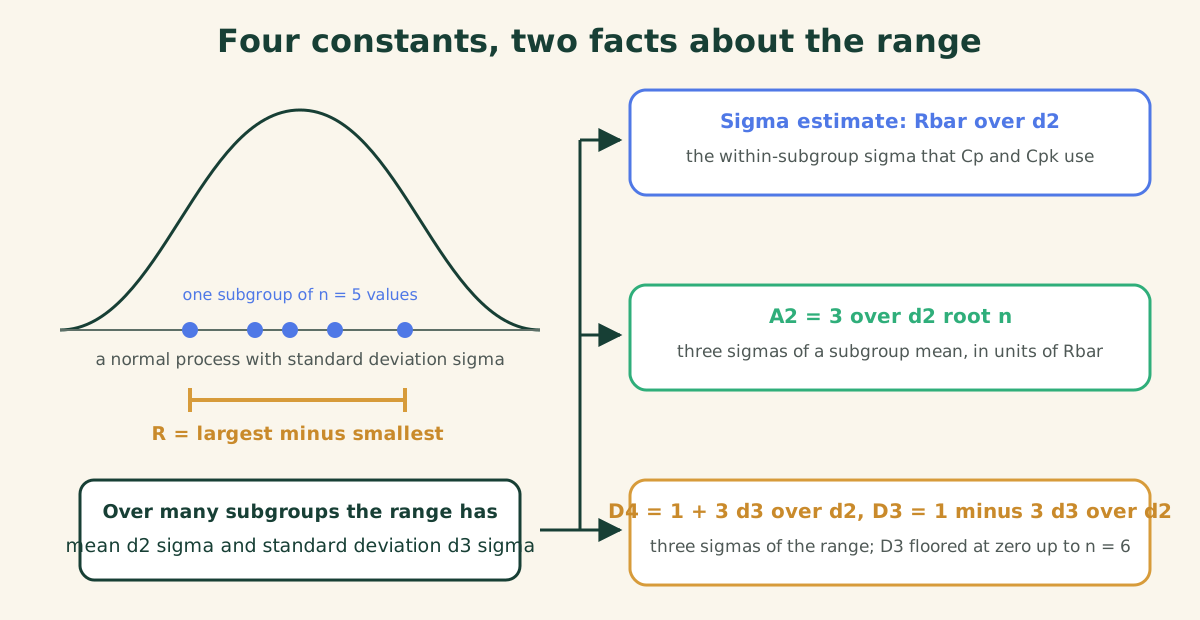
Take n values from a normal process with standard deviation sigma and compute their range, largest minus smallest. Do it many times. The ranges have a distribution of their own, and that distribution has a mean and a standard deviation, both proportional to sigma. The mean of the range is d2 sigma. The standard deviation of the range is d3 sigma. Every other constant on a range-based chart is built from those two.
d2 is the one to understand first. Because the average range of a subgroup is d2 times sigma, the average range over many subgroups, Rbar, divided by d2 is an estimate of sigma. That is the within-subgroup sigma, the common-cause spread, and it is the sigma Cp and Cpk use.
A2 comes next. The Xbar chart needs limits at three standard deviations of a subgroup mean, which is 3 sigma over root n. Substitute Rbar over d2 for sigma and the half-width becomes A2 Rbar, with A2 = 3 / (d2 sqrt(n)). For n = 5 that is 3 divided by 2.326 and by the square root of 5, which comes to 0.577.
D4 and D3 set the R chart. Its center is Rbar and its limits are Rbar plus and minus three standard deviations of the range, which is 3 d3 sigma, or 3 d3 Rbar over d2. So D4 = 1 + 3 d3 / d2 and D3 = 1 - 3 d3 / d2. For n = 5, d3 is 0.8641 and d2 is 2.3259, so three times their ratio is a little over one: D4 comes to 2.1145 and D3 goes negative, which a range cannot do, so it is floored at zero.
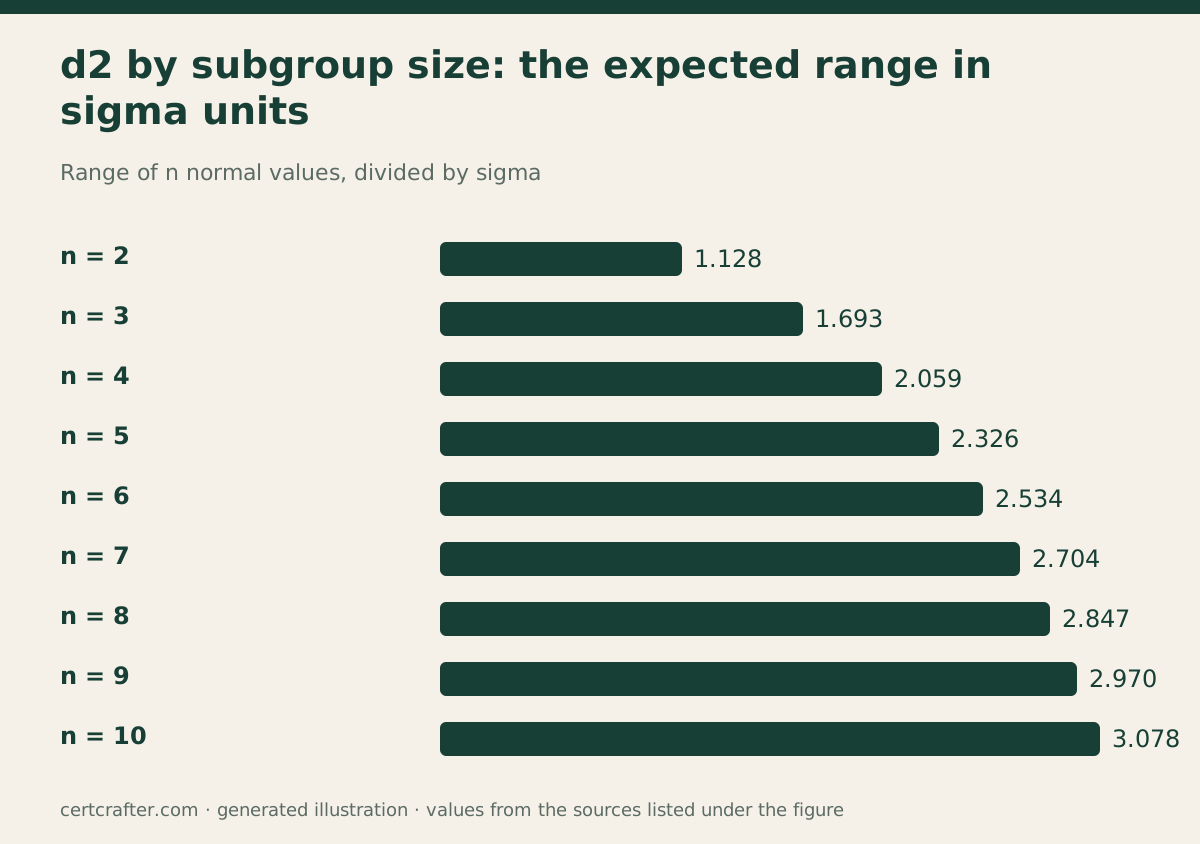
What are the values for subgroups of 2 to 10?
| n | d2 | A2 | D3 | D4 |
|---|---|---|---|---|
| 2 | 1.128 | 1.880 | 0 | 3.267 |
| 3 | 1.693 | 1.023 | 0 | 2.574 |
| 4 | 2.059 | 0.729 | 0 | 2.282 |
| 5 | 2.326 | 0.577 | 0 | 2.114 |
| 6 | 2.534 | 0.483 | 0 | 2.004 |
| 7 | 2.704 | 0.419 | 0.076 | 1.924 |
| 8 | 2.847 | 0.373 | 0.136 | 1.864 |
| 9 | 2.970 | 0.337 | 0.184 | 1.816 |
| 10 | 3.078 | 0.308 | 0.223 | 1.777 |
Read down the columns and the logic shows. d2 grows with n because a bigger sample reaches further into the tails. A2 shrinks for two reasons at once: d2 in the denominator grows, and so does root n. D4 falls toward 1 and D3 rises from zero as the range becomes a steadier statistic. Beyond n = 10 the range wastes information and the Xbar-s chart takes over, with A3, B3, B4 and c4 playing the same roles for sbar.
The individuals chart is the n = 2 row in disguise. Its moving range of two consecutive readings has d2 of 1.128, so E2 is 3 over 1.128, which is 2.660, and the moving range limit is 3.267 MRbar.
Worked example: Xbar-R limits for subgroups of five
Twenty-five subgroups of n = 5 give Xbarbar = 50.12 and Rbar = 1.84. From the table, A2 = 0.577, D3 = 0, D4 = 2.114 and d2 = 2.326.
- Half-width of the Xbar limits: 0.577 × 1.84 = 1.062.
- UCL for Xbar: 50.12 + 1.062 = 51.182. LCL for Xbar: 50.12 minus 1.062 = 49.058.
- UCL for R: 2.114 × 1.84 = 3.890. LCL for R: 0 × 1.84 = 0.
- Sigma estimate: 1.84 / 2.326 = 0.7911.
Read the R chart first. If a range falls above 3.890 the subgroup’s spread is out of control and the Xbar limits, which were built from Rbar, mean nothing until the cause is found and the limits recomputed. Only then read the Xbar chart against 49.058 and 51.182.
The same data give the zones for the run rules. The standard deviation of a subgroup mean is 0.7911 over root 5, about 0.3538, so the one-sigma lines sit at 49.766 and 50.474 and the two-sigma lines at 49.412 and 50.828. Two of three consecutive means above 50.828 is a signal even if none crosses 51.18.
The ASQ CQE Complete Exam Kit works the Xbar-s, individuals, p, np, c and u limits the same way, with a constants table computed for the kit and an explanation for every option.
How are the constants used on a real line?
The constants only mean something if the subgroups are rational. A subgroup should hold only common-cause variation: consecutive parts from one machine, one cavity, one operator, over a short time. Then Rbar over d2 is the common-cause sigma and the limits test the differences between subgroups, which is where special causes live.
Mix two machines inside one subgroup and the arithmetic still runs, but the answer is wrong. With two machines offset by about 0.6, subgroups of four taken by machine give Rbar 0.065 and a sigma estimate of 0.0316, and the chart sees the difference at once. Subgroups of four made of two parts from each machine give Rbar 0.6425 and a sigma estimate ten times larger, so every subgroup mean sits comfortably inside limits that are ten times too wide. The offset is buried inside the subgroups, and d2 cannot dig it out.
Set the limits from 20 to 25 subgroups collected while the process behaved, drop subgroups with a known cause, recompute, then freeze them. A plant that recomputes limits every week has a chart that never signals.
How does the CQE exam ask about constants?
The stem gives Xbarbar and Rbar with n, and asks for a limit or the sigma estimate. The distractors are built from the wrong constant: D4 applied to the Xbar chart, A2 used with sbar, the sigma estimate taken as Rbar over A2, or a limit computed with the n = 2 row because the candidate grabbed the wrong line of the table. A second kind of stem describes a pattern of points and asks which rule fires, which only works if you know the zones come from sigma over root n and not from sigma.
Both kinds reward the same habit. Say what each constant is before you use it, and the wrong option stops looking plausible.
What to do next
Pull a constants table into your bound references and mark the n = 5 row, because most stems use it. Then try the free 20-question sample and time the control chart items; under two minutes each is the target. Unofficial: CertCrafter is not affiliated with ASQ, and ASQ does not endorse this page.
Comments
Comments are read by a person before they appear. How we moderate.